

Monitoring
Know before your users do
Every server reports CPU, load, memory, disk and network once a minute, and every site is checked from outside every 15 minutes. Set thresholds, add heartbeats for your jobs and get one message when something changes, not one every minute.
Server metrics
Every server, measured every minute
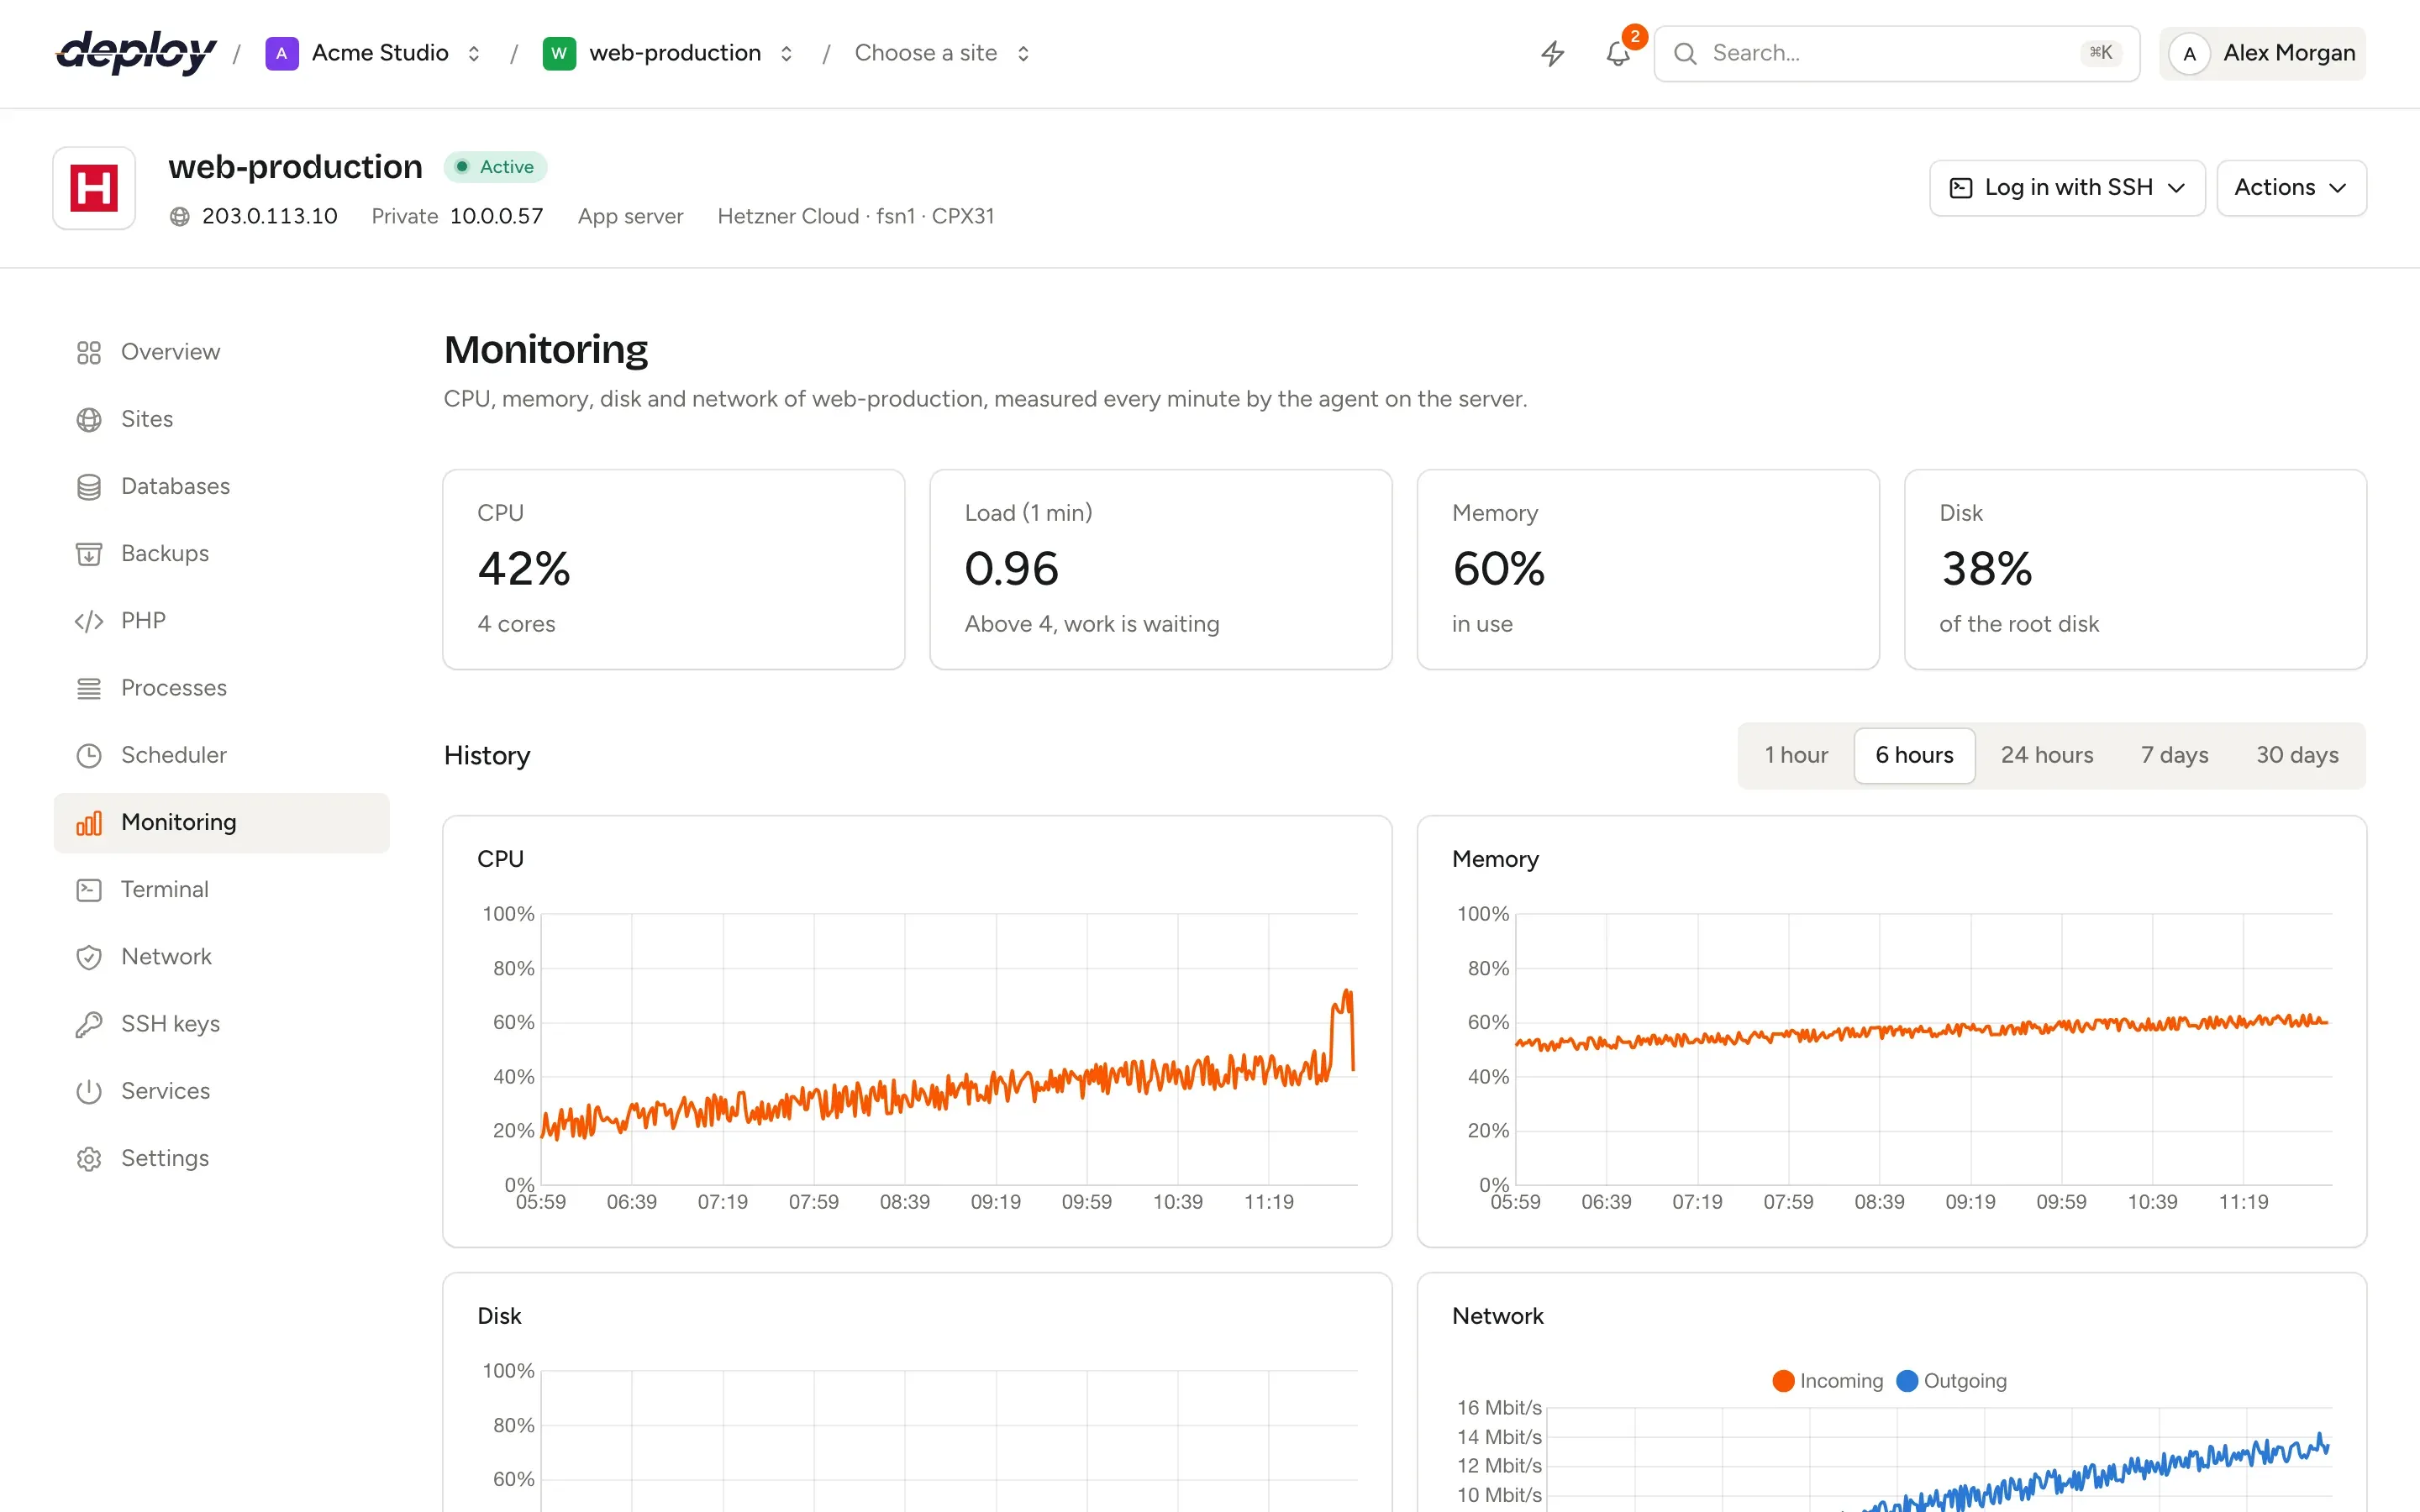
Provisioning installs a small bash agent that cron runs once a minute. It measures the server and posts the numbers over HTTPS with a token for that server only. No port is opened and no daemon runs.
The Monitoring page shows the latest figures and charts for 1 hour, 6 hours, 24 hours, 7 days or 30 days. CPU, memory and disk turn orange from 75% and red from 90%. Measurements are kept for 31 days.
What the agent measures
CPU and load
The share of CPU time that was busy over one second, and the one-minute load average next to the number of cores.
Memory
Memory in use, total minus available, as a percentage.
Disk
Used space on the root disk, so you see a full disk coming.
Network
Bytes in and out on the main network interface, shown in Mbit/s.
SSH logins
Every successful SSH login, with the user, IP address and key, on the server's Security page.
Restart needed
When Ubuntu asks for a restart after updates, and for which packages.
Monitors
Alerts that wait for a real problem
A monitor watches CPU usage, CPU load, memory usage or disk usage against a threshold for 1 to 60 minutes. It only raises an alarm when the value was at or above the threshold in every minute of that window; a minute without data never counts, so a gap cannot trigger it.
You get one email when the alarm starts, such as *Warning: CPU usage on web-1 is 96%*, and one when it recovers. Good starting points: CPU at 90% for 5 minutes, memory at 90% for 5 minutes, disk at 85% for 1 minute.
Heartbeats
Know when a scheduled job goes quiet
Cron does not tell you when a job stops. A heartbeat does: add one with the interval and a grace period, and have the job call its URL when it succeeds. If the call does not arrive in time, the heartbeat becomes Missed and you get an email; when the job calls again, you hear that too.
Heartbeats are checked every minute. The URL accepts GET and POST and answers OK.
php /home/vimonto/example.com/current/artisan backup:run \
  && curl -fsS -m 10 https://deploy.example.com/heartbeat/your-token
Uptime monitoring
Every site checked from outside, every 15 minutes
Uptime checks are on for every site from the start, with nothing to install. The site's overview shows the current status, uptime over 24 hours, 7, 30 and 90 days, and the average response time.
Checked like a visitor
A
GETto the primary domain over HTTPS when the site has a certificate, following up to five redirects, with a 10-second timeout.No false alarms
A site counts as down after two failed checks in a row and as up again after one success. A site behind a password counts as up on
401.90-day grid
One square per day, coloured by uptime, with the checks and minutes of downtime on hover, plus a strip of the last 96 checks.
Your health route
Check a path such as Laravel's
/upinstead of the home page, or switch checks off for planned maintenance.
Status pages
Public status pages
Give your customers one page that shows whether everything works. A status page on its own address shows your sites, heartbeats and servers, each with a bar of the last 90 days, and the incidents and maintenance you post.
- Components from site uptime checks, heartbeats and servers, grouped in sections
- One headline for everything: operational, degraded performance, partial or major outage
- Incidents with updates, and scheduled maintenance
- Public: visitors need no account
Notifications
Told once, in the way each person chooses
Monitor alerts, missed heartbeats, sites going down, failed backups, failed deploys and failed certificates reach every member who can see the server, in the bell in the app and by email. Each person chooses per kind of notification which channel they want, and can mute servers they do not follow.
By default failures come by email and in the app, and good news only in the app. A monitor or heartbeat can also email a shared address, such as your team's mailbox, without that person being a member.
Questions about monitoring
Does monitoring cost extra or slow down my server?
No. Monitoring is in every plan. The agent runs for about a second each minute and sends a few numbers.
Can I check my sites more often than every 15 minutes?
No. Every site is checked every 15 minutes, and checks are kept for 90 days.
Can I send alerts to Slack?
There is no Slack integration. Alerts go by email and to the bell in the app; enter a shared mailbox as the address to notify. For deploys, a site's deploy hook can post to your own endpoint.
Can I monitor a database or cache server?
Yes. The agent runs on every server type, including database, cache, Meilisearch and load balancer servers.
Will the uptime check show up in my statistics?
Only in statistics that read the access log. The check uses the user agent VimontoDeploy-Uptime/1.0, so you can filter it out. Browser analytics do not see it.
Related pages
- ServersProvisioning for every role: app, web, worker, database, cache, search and load balancer servers.
- Databases and backupsMySQL, MariaDB or PostgreSQL, database users and scheduled backups to your own bucket.
- AutomationA REST API, a CLI for CI, deploy URLs, recipes for repeated scripts and deploy hooks.
Your next deploy could be live before your coffee is.
Create an organization, connect a server and push. That is all.